Cloud Monitoring
- Cloud Monitoring helps understand and visualize the performance and health of AWS resources.
- The main AWS service for monitoring is Amazon CloudWatch.
CloudWatch Metrics
Definition
- Metrics: Variables that represent the performance of AWS resources over time.
- Examples:
CPUUtilization(for EC2)NetworkInandNetworkOutBilling(total AWS spending)
Key Points
- Metrics are timestamped data points collected periodically.
- You can visualize metrics in CloudWatch Dashboards.
- Billing Metric:
- Available only in us-east-1 region.
- Represents total AWS spending for the entire account.
- Resets monthly.
Common Metrics by Service
| Service | Common Metrics | Notes |
|---|---|---|
| EC2 | CPUUtilization, StatusCheck, NetworkIn/Out | RAM metrics are not available |
| EBS | DiskReadOps, DiskWriteOps | Measures disk I/O |
| S3 | BucketSizeBytes, NumberOfObjects, AllRequests | Tracks storage and request activity |
| Billing | EstimatedCharges | Account-wide billing data (us-east-1) |
| Service Limits | API usage | Helps monitor resource limits |
| Custom Metrics | User-defined | Push your own metrics if needed |
Metric Frequency
- Standard Monitoring: every 5 minutes (default, free).
- Detailed Monitoring: every 1 minute (paid).
CloudWatch Alarms
- Alarms trigger actions based on metric thresholds.
- Example: When CPU utilization > 90%, send an alert.
Alarm Actions
- Auto Scaling Actions – increase/decrease EC2 instance count automatically.
- EC2 Actions – stop, terminate, reboot, or recover instances.
- SNS Notifications – send alerts via email, SMS, or other channels.
Billing Alarms
- Set alarms on the Billing metric to get notified when estimated charges exceed a certain amount (e.g., $10 or $20).
Alarm States
| State | Meaning |
|---|---|
| OK | Metric within normal range |
| INSUFFICIENT_DATA | Not enough data points |
| ALARM | Threshold breached (bad condition) |
Evaluation Options
- You can configure:
- Statistic type (average, min, max, percentage)
- Evaluation period (e.g., 5 minutes, 1 hour)
Summary
- CloudWatch Metrics track performance data.
- CloudWatch Alarms automate responses or notifications when thresholds are crossed.
- Billing Metrics and Alarms help control costs.
- Custom Metrics allow monitoring of user-defined data.
Amazon CloudWatch Logs
Purpose
- CloudWatch Logs is used to collect, monitor, store, and analyze log files from various AWS services and on-premises systems.
- Enables real-time monitoring and troubleshooting of applications and infrastructure.
What Are Log Files?
- Logs are records of events and activities generated by applications or systems.
- Used for debugging, troubleshooting, and performance analysis.
- Example: logs that record user actions, errors, cleanup tasks, or background processes.
Log Sources
CloudWatch Logs can collect logs from:
- Elastic Beanstalk – application and environment logs.
- ECS (Elastic Container Service).
- AWS Lambda – automatically sends logs to CloudWatch.
- CloudTrail – for auditing API calls.
- EC2 instances – using the CloudWatch Logs Agent.
- On-premises servers – via the same agent.
- Route 53 – for DNS query logs.
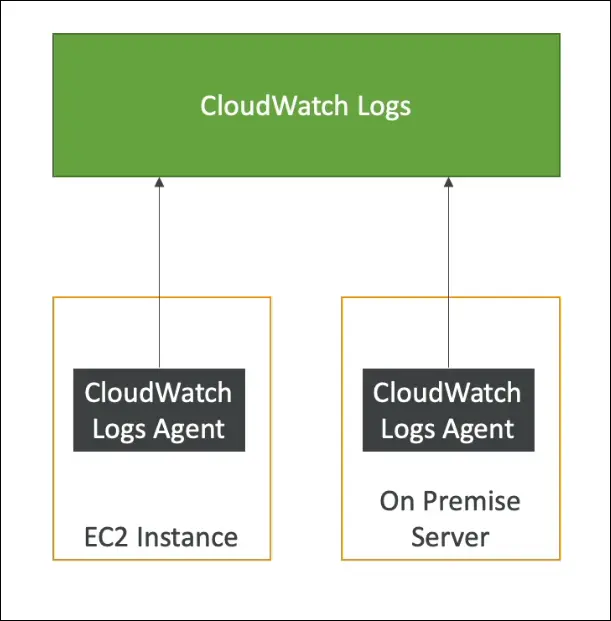
CloudWatch Logs Agent
- Purpose: Sends log data from EC2 or on-premises servers to CloudWatch Logs.
- Setup:
- Install the CloudWatch Logs agent on the instance/server.
- Configure which log files to send.
- Ensure the instance has an IAM role with permissions to write to CloudWatch Logs.
- Hybrid capability: Works on both AWS and on-premises environments.
Retention and Management
- Log retention periods are configurable:
- Options include 1 week, 30 days, 1 year, or indefinite storage.
- Logs can be searched, filtered, and visualized in real-time.
- Useful for alerting when specific log patterns occur.
Use Case Example (EC2)
- By default, EC2 does not send logs to CloudWatch.
- After installing and configuring the CloudWatch Logs Agent, logs from EC2 are pushed to CloudWatch Logs for central monitoring and analysis.
Summary
| Feature | Description |
|---|---|
| Service | Amazon CloudWatch Logs |
| Main Function | Collect and monitor log data |
| Data Sources | EC2, Lambda, ECS, Beanstalk, CloudTrail, Route 53, on-premises servers |
| Agent Requirement | Yes, for EC2 and on-premises |
| IAM Role Needed | Yes, to allow log data upload |
| Retention Options | 1 week to infinite |
| Supports Hybrid Use | Yes (AWS + on-premises) |
Amazon EventBridge (formerly CloudWatch Events)
Purpose
- Reacts to events happening in your AWS account or from external sources.
- Can also be used to schedule cron jobs (serverless scheduling).
Key Concepts
1. EventBridge Use Cases
- Cron jobs: Schedule scripts to run regularly (e.g., every hour trigger a Lambda).
- Automated reactions: Respond to AWS events (e.g., root user sign-in, EC2 state change).
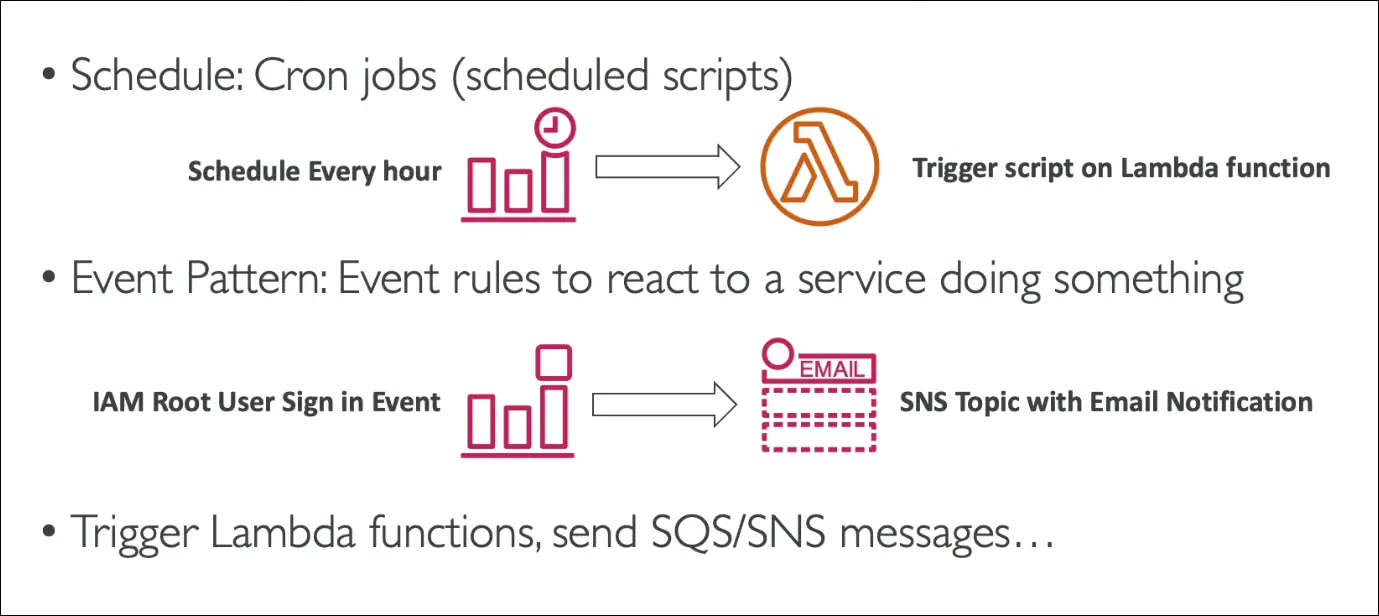
2. Example
- Detect IAM root user sign-in → send event to SNS → email alert to security team.
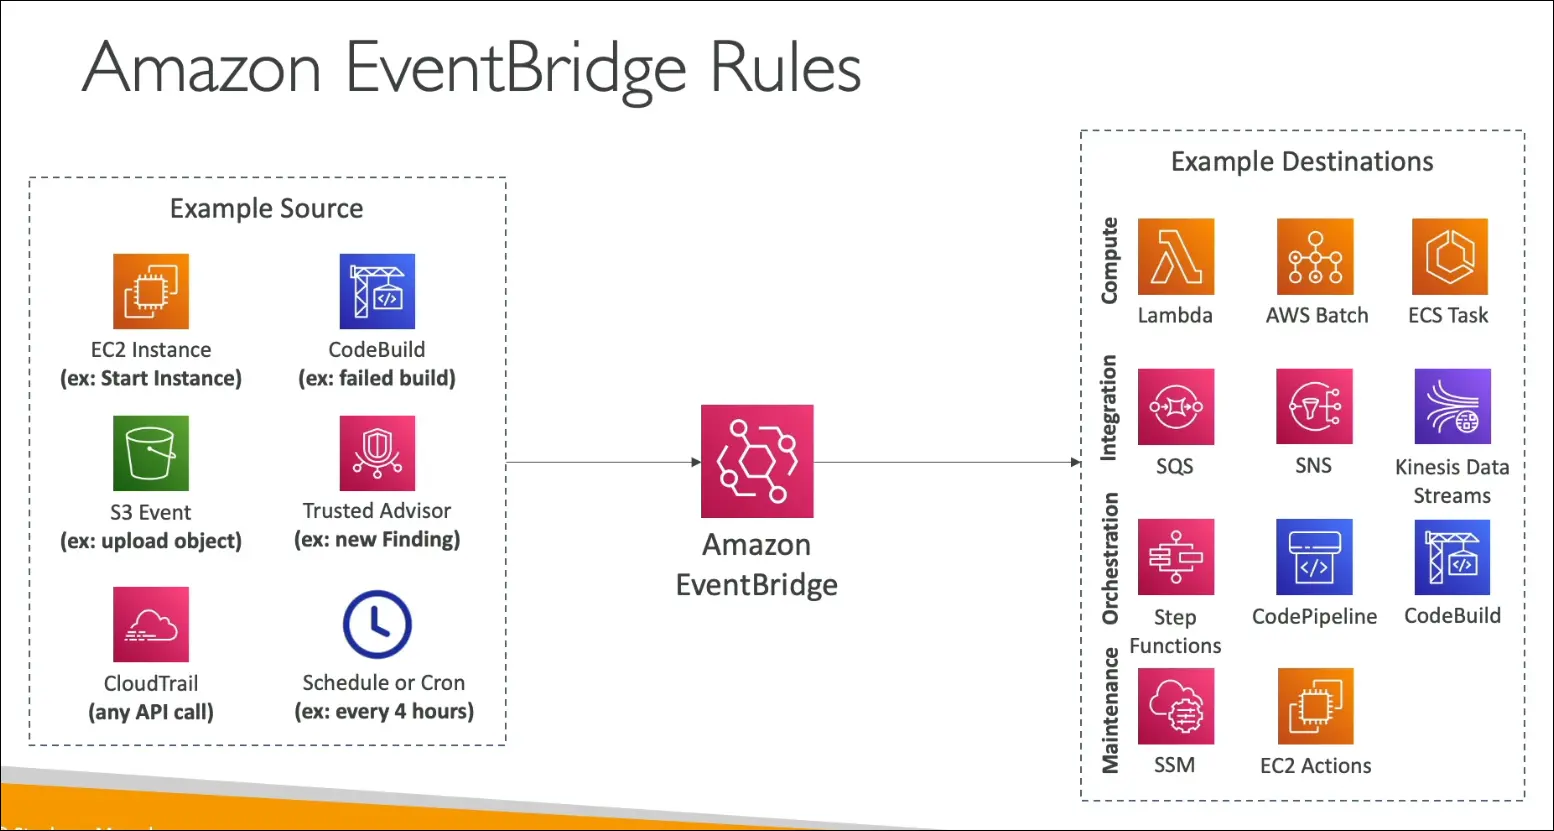
Event Sources
- AWS Services: EC2, CodeBuild, S3 events, Trusted Advisor, etc.
- Schedule-based: Cron or rate expressions.
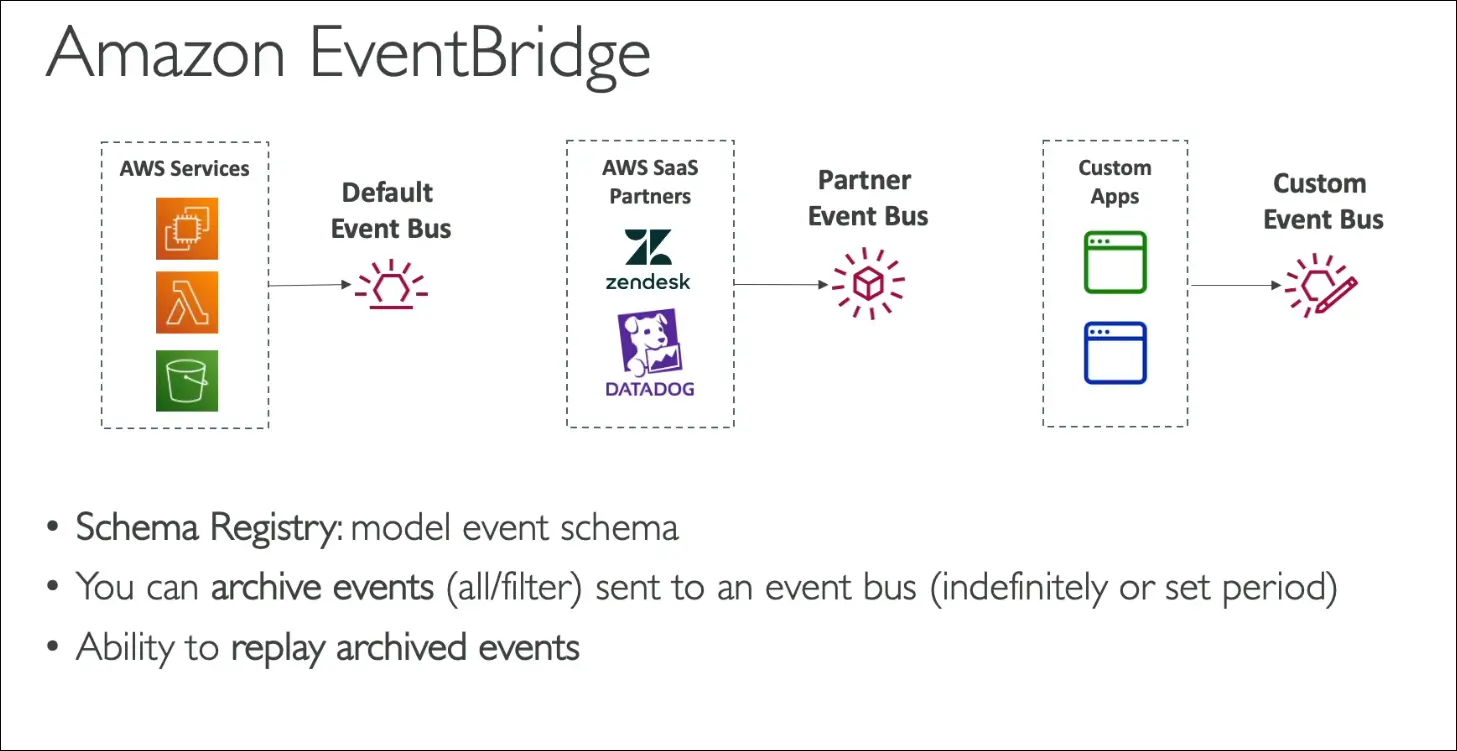
- Partner Event Bus: From AWS partners like Datadog, Zendesk, etc.
- Custom Event Bus: From your own applications to send and handle custom events.
Event Destinations
- Lambda function (common)
- SNS or SQS
- Step Functions
- Other AWS services for orchestration or automation
Advanced Features
- Schema Registry:
Defines and models event structure (data types, schema). - Event Archive:
Archive all events indefinitely or for a defined time. - Replay Events:
Replay past archived events for debugging or recovery.
EventBridge Structure
- Event Source: Something happens (AWS service, app, or schedule).
- Event Bus: Routes the event.
- Rule: Defines which events trigger which actions.
- Target: Destination service (Lambda, SNS, etc.).
Summary
- EventBridge = event-driven automation service.
- Used for cron jobs, reactive workflows, and cross-service integration.
- Supports AWS events, partner events, and custom app events.
- Advanced features include schema registry, archive, and replay.
AWS CloudTrail
Purpose
- CloudTrail provides governance, compliance, and auditing for your AWS account.
- It records API calls and events across your AWS environment.
- Enabled by default for every AWS account.
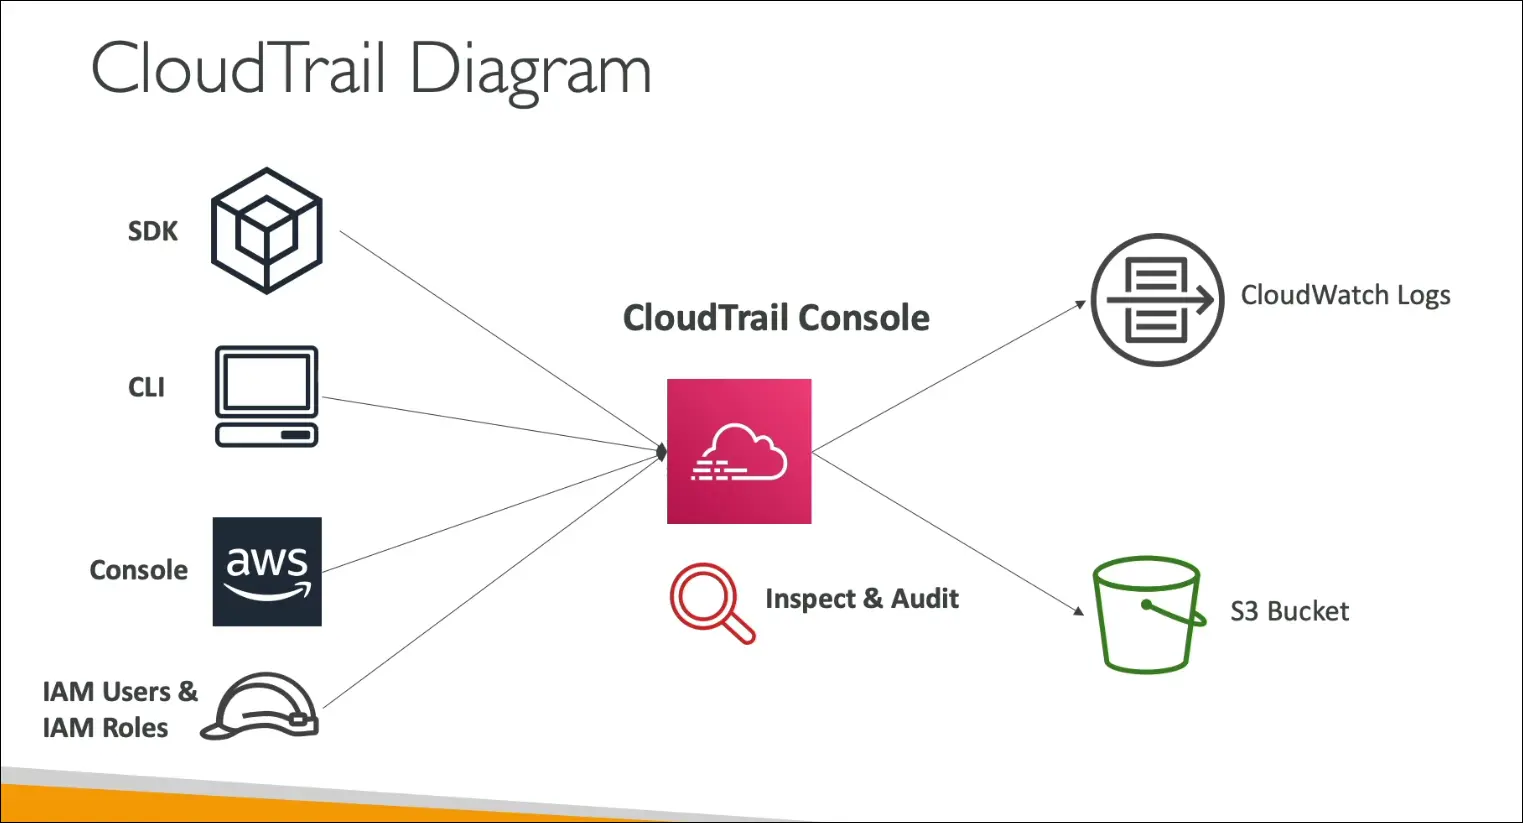
What CloudTrail Records
CloudTrail logs who did what, where, and when in your AWS account.
It tracks all API interactions through:
- AWS Management Console
- AWS CLI
- AWS SDKs
- AWS Services (internal actions)
Examples:
- User logs into AWS console → logged in CloudTrail
- Command executed via CLI → logged in CloudTrail
- API call made by SDK → logged in CloudTrail
Storage of Logs
CloudTrail logs can be sent to:
- Amazon S3 → for long-term storage and compliance
- Amazon CloudWatch Logs → for real-time monitoring and alerting
You can create a Trail that applies to:
- All regions (recommended for full visibility)
- Single region (limited scope)
Use Case Example
If a user deletes a resource (e.g., an EC2 instance or S3 bucket):
- You can check CloudTrail to find:
- Who deleted it
- When it happened
- From where (source IP)
- Which API call was used
Key Features
| Feature | Description |
|---|---|
| Default Status | Enabled for all AWS accounts |
| Tracks | Console, CLI, SDK, and service API activity |
| Retention | Long-term storage via S3 |
| Monitoring | Real-time insights via CloudWatch Logs |
| Multi-region Trails | Option to monitor all regions |
| Use Case | Security analysis, auditing, troubleshooting |
Summary
- CloudTrail = audit log of AWS API activity.
- Logs who did what and when for security and compliance.
- Integrates with S3 (for storage) and CloudWatch Logs (for alerts).
- Always check CloudTrail when you need to identify who made a change in your AWS environment.
AWS X-Ray
Purpose
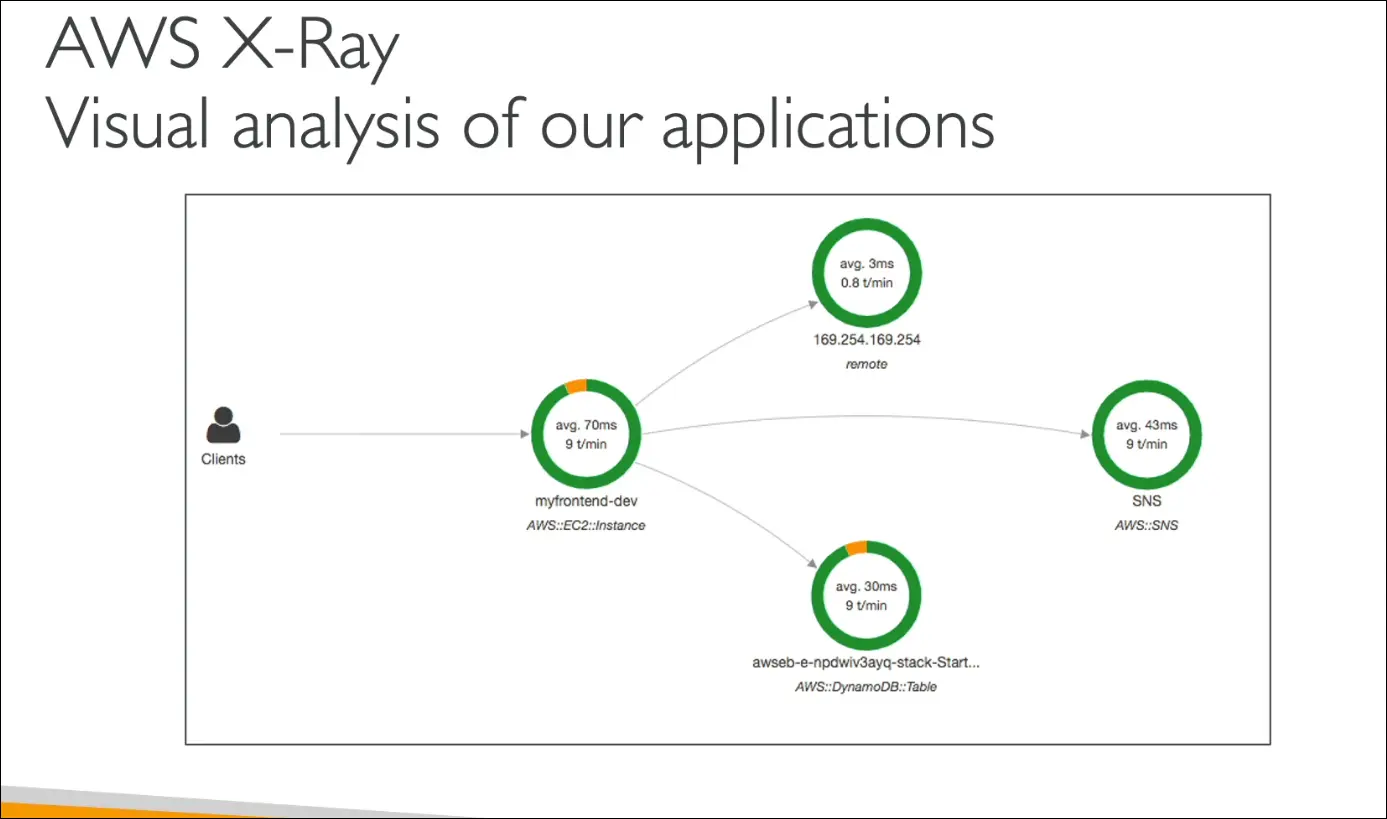
- AWS X-Ray helps analyze and debug distributed applications in production or development.
- Provides end-to-end tracing of requests as they travel through multiple AWS services.
- Offers visual insights into application performance and dependencies.
Why X-Ray Is Needed
Without X-Ray:
- Logs are spread across multiple services, hard to combine and analyze.
- Debugging distributed architectures (like microservices using SQS, SNS, Lambda, etc.) becomes complex.
- No single view of how requests move through the system.
X-Ray solves this by giving a centralized trace of all service interactions.
Key Features
| Feature | Description |
|---|---|
| Distributed Tracing | Tracks a request end-to-end across all AWS services. |
| Service Map / Graph | Visual representation of how components (services, APIs, functions) interact. |
| Performance Bottlenecks | Identifies which part of the system causes delays or throttling. |
| Error Analysis | Detects and visualizes errors and exceptions in requests. |
| Dependency Mapping | Shows relationships between microservices. |
| SLA Monitoring | Verifies if your app meets response-time targets. |
| User Impact | Identifies which users are affected by an issue. |
Benefits
- Visual debugging for microservice-based or distributed systems.
- Quickly pinpoints issues (slow responses, timeouts, throttling).
- Helps optimize performance and improve reliability.
- Useful for both developers and DevOps teams.
Common Exam Use Cases
| Scenario | AWS Service |
|---|---|
| Find who made an API call | CloudTrail |
| Monitor performance metrics | CloudWatch |
| Trace individual requests through multiple services | X-Ray |
Summary
- AWS X-Ray = request tracing, debugging, and visualization tool.
- Used for distributed tracing across multiple AWS services.
- Best for troubleshooting, performance analysis, and microservices visualization.
- Integrated with EC2, Lambda, ECS, API Gateway, and more.
- No hands-on for the CCP exam—just understand what it does.
Amazon CodeGuru (Overview)
Definition:
A machine learning-powered service that provides:
- Automated code reviews (CodeGuru Reviewer)
- Application performance recommendations (CodeGuru Profiler)
Purpose:
- Detects bugs, security issues, and inefficiencies automatically.
- Improves code quality and application performance with minimal human intervention.
CodeGuru Reviewer
Function:
Performs static code analysis to automatically review code when you push commits to repositories such as:
- CodeCommit
- GitHub
- Bitbucket
Key Features:
- Identifies critical issues, security vulnerabilities, and hard-to-find bugs.
- Detects resource leaks, input validation errors, and security holes.
- Provides actionable recommendations directly in your code.
- Uses machine learning and automated reasoning trained on:
- Thousands of open-source repositories
- Amazon.com’s internal repositories
Supported Languages:
- Java
- Python
Use Case:
When developers push code, CodeGuru Reviewer analyzes it and comments on potential problems or best practice violations.
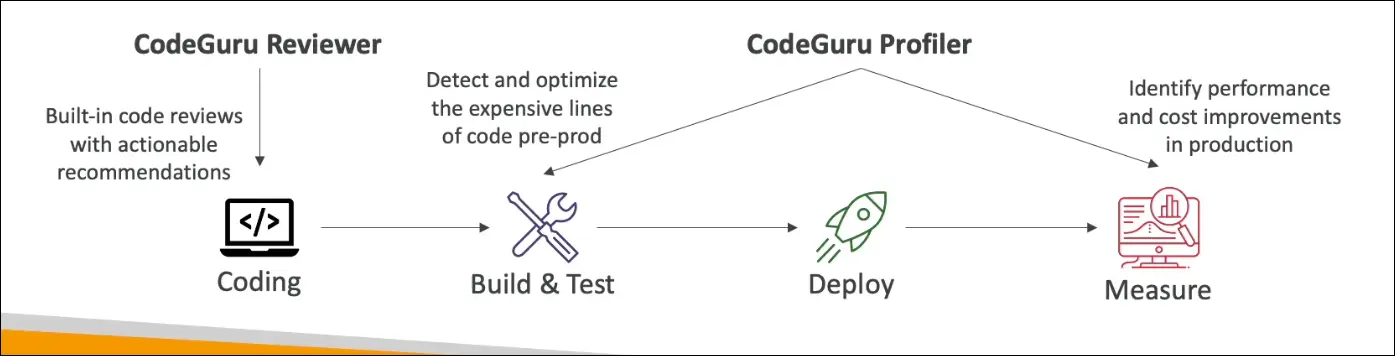
CodeGuru Profiler
Function:
Analyzes runtime behavior of applications in production or pre-production environments.
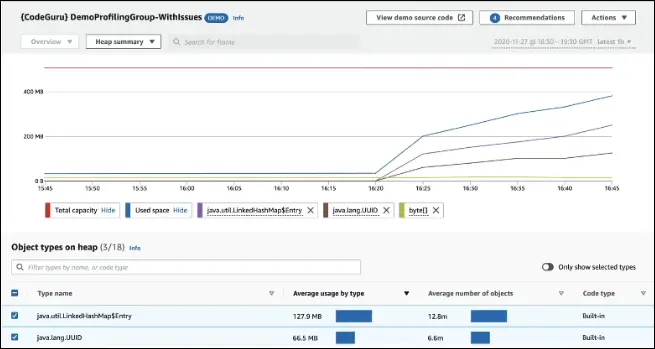
Key Features:
- Identifies performance bottlenecks and cost inefficiencies.
- Detects excessive CPU usage, memory-heavy objects, and code inefficiencies.
- Provides heap summaries to identify objects using a lot of memory.
- Detects anomalies in runtime behavior.
- Helps to reduce compute costs and optimize performance.
- Adds minimal overhead to the monitored application.
- Works for applications running on AWS or on-premises.
Example:
If a logging function consumes too much CPU, CodeGuru Profiler detects it and suggests optimizations.
Summary
| Component | Purpose | Key Capabilities |
|---|---|---|
| CodeGuru Reviewer | Automated code reviews | Finds bugs, security issues, and resource leaks before deployment |
| CodeGuru Profiler | Runtime performance analysis | Optimizes performance, reduces costs, detects anomalies |
Remember for Exam (AWS CCP):
- CodeGuru = ML-powered service for automated code review and performance profiling.
- Reviewer = static analysis (before deploy)
- Profiler = runtime analysis (after deploy)
- Supports Java and Python, integrates with GitHub, Bitbucket, and CodeCommit.
AWS Health Dashboard
There are two main parts of the AWS Health Dashboard:
- Service Health Dashboard (Public View)
- Account Health Dashboard (Personal View)
Service Health Dashboard
- Shows current and historical health of all AWS services across all regions.
- Provides general AWS-wide information (not account-specific).
- You can check:
- Regional service statuses
- Historical issues (day-by-day)
- Subscribe to RSS feed for updates
- Previously called the AWS Service Health Dashboard.
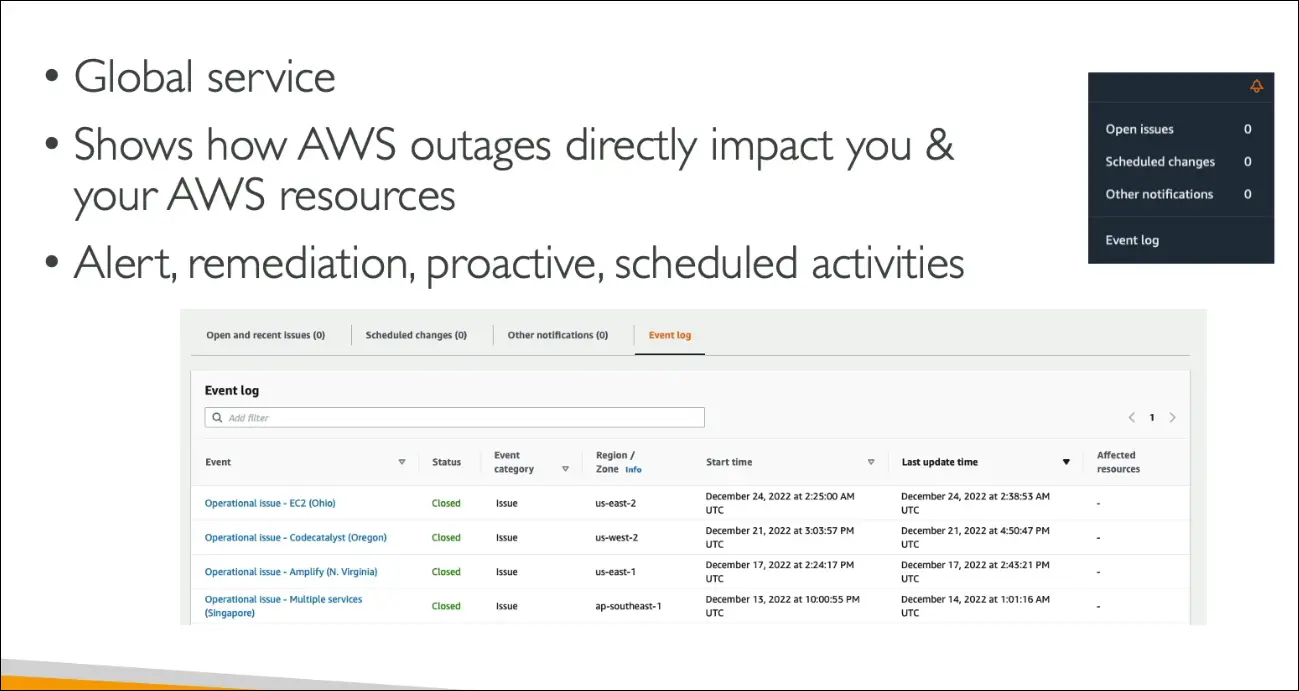
Account Health Dashboard (for your AWS account)
- Formerly known as Personal Health Dashboard (PHD).
- Gives alerts, notifications, and remediation guidance for issues affecting your own resources.
- Helps you monitor:
- Performance and availability of AWS services you use
- Events impacting your account (e.g., EC2 issue in a specific region)
- Provides:
- Event log (past incidents)
- Scheduled maintenance notifications
- Proactive alerts for upcoming changes
- Can aggregate health information across your AWS Organizations accounts.
- Access from the top-right corner (bell icon) in the AWS Console.
- It’s a global service showing outages or events that directly impact you.
Summary
| Dashboard | Scope | Purpose | Example |
|---|---|---|---|
| Service Health Dashboard | All AWS services (public) | View general AWS status & outages | Check if S3 is down in us-east-1 |
| Account Health Dashboard | Your AWS account (private) | Personalized alerts & guidance | See EC2 issue affecting your account |
AWS Monitoring and Observability - Summary
AWS provides multiple tools for monitoring, logging, auditing, and debugging your applications and infrastructure.
Amazon CloudWatch
A suite of tools for monitoring and automating AWS service performance.
CloudWatch Metrics
- Collects and monitors performance metrics of AWS services and billing.
- Example: CPU utilization, disk I/O, network usage.
CloudWatch Alarms
- Triggers actions when metrics exceed defined thresholds.
- Can:
- Send notifications via SNS
- Perform EC2 actions (e.g., reboot, stop, terminate)
- Automate responses to metric changes
CloudWatch Logs
- Centralized log management for:
- EC2 instances
- Lambda functions
- On-premises servers
- Helps monitor and analyze logs in real-time.
CloudWatch Events (now called Amazon EventBridge)
- Reacts to AWS service events or scheduled rules.
- Example: Trigger Lambda when an EC2 instance state changes.
AWS CloudTrail
- Records all API calls made within your AWS account.
- Tracks who did what, when, and from where.
- Used for auditing and security analysis.
CloudTrail Insights
- Uses machine learning to detect unusual API activity automatically.
- Example: Detects spikes in IAM access or EC2 instance launches.
AWS X-Ray
- Used for tracing requests across distributed applications.
- Helps with:
- Root cause analysis
- Performance troubleshooting
- Understanding how microservices interact
- Ideal for debugging serverless and microservice architectures.
AWS Health Dashboard
- Two views:
- Service Health Dashboard → General status of all AWS services and regions.
- Account Health Dashboard → Personalized view showing events that impact your own resources.
Amazon CodeGuru
- AI-powered service for:
- Automated code reviews (CodeGuru Reviewer)
- Application performance profiling (CodeGuru Profiler)
- Detects bugs, inefficiencies, and performance issues using machine learning.
Summary Table
| Service | Purpose | Key Use Case |
|---|---|---|
| CloudWatch Metrics | Monitor resource performance | Track EC2 CPU usage |
| CloudWatch Alarms | Automate alerts/actions | Reboot EC2 when CPU > 80% |
| CloudWatch Logs | Collect and analyze logs | Centralize Lambda logs |
| EventBridge (CloudWatch Events) | React to events or schedules | Trigger Lambda on EC2 state change |
| CloudTrail | Audit API calls | Detect unauthorized actions |
| CloudTrail Insights | Detect unusual activity | Spike in IAM API calls |
| X-Ray | Trace distributed requests | Debug microservice performance |
| Health Dashboard | Monitor AWS/global health | View service outages or account impacts |
| CodeGuru | AI-based code and performance review | Optimize production code efficiency |